Xurrent IMR Analytics Dashboard
Xurrent IMR Analytics Dashboard
Year
2025
Project type
Data Visualization
Tool Stack

When an incident ends, the real work begins. Not fixing it again. Preventing it entirely. To do that, teams need clarity.
How often incidents occur, when spikes happen, how response times change, and whether things are actually improving.
Without this visibility, you’re just reacting. Not evolving. Xurrent IMR Analytics gives you that full picture.
A clear, real-time view of your incident ecosystem:
Incident trends over time
Spike detection and patterns
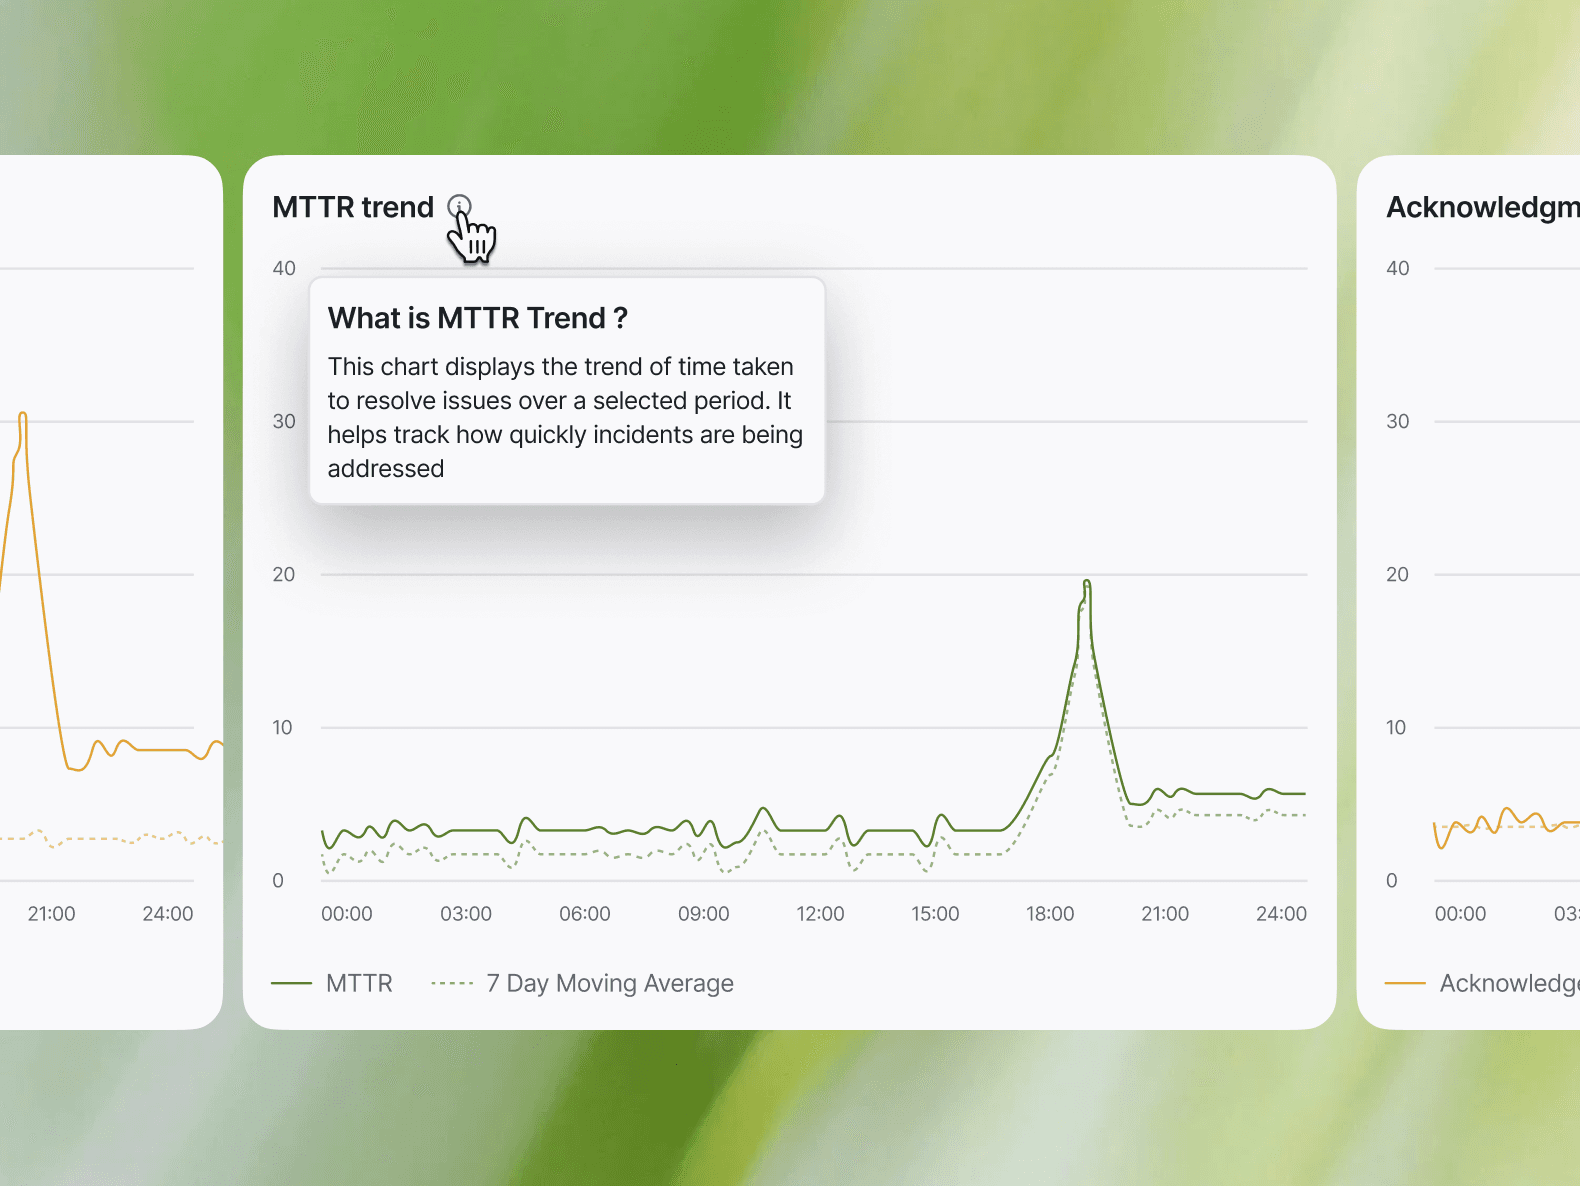
Mean Time to Respond (MTTR)
Mean Time to Resolve (MTTR)
Team-wise load distribution
The goal is simple: fewer incidents, faster responses, and a system that gets better every month.
Xurrent IMR Analytics need to help engineering teams to move from reactive firefighting to predictable, data-driven incident management. Scalable Repeatable and Predictable